Google’s Web Vitals initiative evaluates each of your pages across three critical metrics to arrive at a UX score, which it then uses as an input for your search ranking. How well you score on these metrics depends on how your site is coded and served.
As we’ve discussed in previous blog posts, user experience (UX) is so much more than usability and user interface design. It’s a qualitative measure of the entire experience of the user with your product. You could have the best content assembled by amazing designers, but if it loads slowly or is sluggish when the user interacts with it, you’ll lose them. Actually, they may never even visit your website.

What is the Web Vitals Initiative?
Since 2010, Google has provided methods for content providers to measure the quality of their offerings and advice on how to improve their scores with the Webmaster Toolkit. This evolved into the Google Search Console in 2015 with different, more precise measurements of the quality of your content. The Web Vitals initiative is the latest iteration in these metrics. While the tools have become more and more technical in what they measure and how they report, this does not mean that you also need to be more technically savvy. The presentation of these metrics is designed so that anyone from a developer to a business owner can run them to learn how well their website is performing.
The Critical Metrics
The Web Vitals Initiative includes many metrics from the domains involved to the content itself, including how it’s requested and processed. They even provide a service that optimizes your images, which you can re-upload for better performance. The critical metrics, however, should be your main focus. These are:
Largest Contentful Paint (LCP)
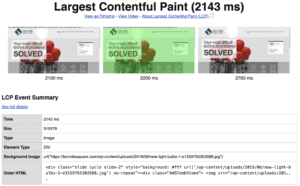
How long until the user sees something useful on your web page? This has historically been difficult to measure if only because how do you programmatically determine what’s useful content. LCP answers this question by measuring the load time of the largest image or block of text that would be visible to the user, starting when the page itself begins to load. Less than 2.5 seconds is a good score, greater than 4 seconds is a failure.

The Ten Mile Square home page rates well for LCP
First Input Delay (FID)
Responsiveness is a good way to measure how well a webpage behaves. FID measures the time between when a user takes an action, such as clicking a button, and when the browser begins to process that action. A good score is less than 100 milliseconds, greater than 300ms is a failure. That may not sound like much time, but it is enough for the user to begin to wonder if they actually took the action. This may lead them to take the action again or do something else. Either case is not a good user experience. Note that this does not measure the time it takes to process the action and present new content. Users are remarkably patient as long as they know something is happening.
For those pages that do not have interactivity, take a look at the Time to Interactive (TTI) metric, which measures how long it takes for a page to be fully interactive. This indicates how quickly a user can start clicking on any buttons, links, or other widgets on the page, an action that would trigger an FID measurement.
Cumulative Layout Shift (CLS)
One of my pet peeves when reading an article is when the content jumps up and down while the page loads images, ads are swapped out, and other inanities that I don’t care about. I can’t read the freaking article! CLS is a rather complicated measure of the number of shifts as well as the size of the shift relative to the viewport. You should have a score of less than 0.1, while a score greater than 0.25 indicates poor performance.

We need to work on our Cumulative Layout Shift
What You Can Do
There are multiple ways you can measure these scores for each of your pages.
- Within the Google Search Console, in the lefthand column, under Experience, you’ll see links for Page Experience and Core Web Vitals. This only works, though, if your site has enough traffic.
- PageSpeed Insights has been updated to incorporate the Web Vitals Initiative. I’ve used the tool for a while and still like it.
- If you are using the Chrome browser, the DevTools function has a Lighthouse tab that provides much of the same information as PageSpeed Insights.
- WebPageTest.com provides more detail than PageSpeed Insights as well as useful charts.
I also recommend that you or someone on your team consults Google’s Improve your website with Web Vitals. This is a collection of articles (one of which is the article I linked to at the top of this post) that details what these measurements are and how you can optimize them.